Drawing tools on crypto charting tools aren’t just fancy extras—they’re the backbone of smart trading strategies. With them, you unlock patterns and levels hidden to the naked eye. My in-depth dive will show you how to use trend lines and support/resistance to your advantage, so you stop missing critical market shifts. Whether you’re a newbie or a pro, you’ll find these insights can transform your analysis and elevate your trades. Ready to sharpen your skills and make more informed decisions? Keep reading as we lay out the power of drawing tools in chart analysis and risk management—it’s a game-changer for your crypto journey.
The Foundational Role of Trend Lines and Support/Resistance in Crypto Analysis
Interpreting Vital Chart Patterns with Trend Lines
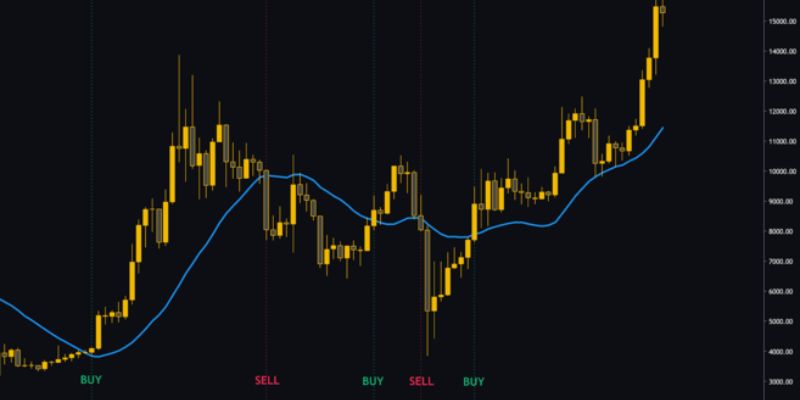
Trend lines are a trader’s road map. They show where prices might go. A rising trend line means “buy” to us. It forms when prices keep hitting higher lows. This you see when bulls win over bears. When we see falling trend lines, with lower highs, we sense a “sell” signal. Here, the bears are in control, pushing prices down. Knowing how to draw these lines is key. It makes the difference in catching a price wave early or missing out.
Trend lines in crypto analysis are straight lines. We draw them on charts to link price points. These points are where the price stopped going up or down, then turned around. These lines predict future price paths. They help traders spot the best times to enter or exit trades. Basically, they are simple but powerful tools. By connecting just two key points, a trend line can shape our trading approach.
Identifying Key Levels: Support and Resistance Insights
We hear “support” and “resistance” a lot. These terms are crucial in crypto trading technical analysis. Support is like a safety net. It’s where the price struggles to fall below. When prices near this level, buyers step in. They keep the price from going lower. Resistance, on the other hand, is a ceiling. It’s hard for prices to break through. Sellers come out at resistance. They take profits, stopping the price from rising.
Finding these levels can feel like a treasure hunt. But it’s worth the effort. They tell us where to watch for price bounces or breaks. A break through resistance can mean a big price leap. But if the price falls below support, it could keep dropping. We use charts to spot these levels. Once seen, we earmark them for future trades.
With trend lines, we draw them across price highs or lows. Support and resistance need more of a zone. This is because markets aren’t exact. Think of them as areas, not lines. A price might push a little beyond before retreating. Or it might not touch the line, but come close. This is where art meets science in crypto chart patterns.
Good charting software for cryptocurrencies has these drawing tool functionalities. They let us plot these vital levels. The right tools can make this easier. We look for features that snap lines to price highs or lows. This makes our planning more precise.
Drawing channels on crypto charts is another powerful technique. Channels are like trend lines in pairs. They map the path of prices moving between two lines: support and resistance. By combining trend lines, support, resistance, and channels, we get a clear view. We can see where to trade and where to wait.
Understanding how to apply these concepts can improve our trading. It can help us see what others miss. It gives us confidence in our predictions. And let’s be real – in the wild crypto markets, a bit of certainty is golden.
The Mastery of Fibonacci and Technical Indicators for Trading Precision
Strategic Fibonacci Retracement Usage for Market Predictions
Ever play connect-the-dots? It feels a bit like that when you use Fibonacci retracement for trading. Here’s the cool part: you link high and low points on charts to see where prices might head. See, the price of Bitcoin or any other crypto doesn’t move up or down in a straight line. It’s more like a zigzag.
People use Fibonacci retracement to guess where the price could bounce back. It’s like predicting where a ball might bounce if you drop it. But this isn’t just any guess; it’s based on math that comes from nature. That’s right, even in tech as fancy as crypto, nature’s numbers give us clues.
Technical Indicators: Enhancing Your Trading Signals
Now, technical indicators are your secret weapons. Think of them like tools in a video game. They level you up in trading. Some tell you if a crypto is overbought or oversold. Others show where prices might go next.
Imagine driving a car. You’ve got mirrors and gauges to help you make decisions. Technical indicators are like those for traders. They give you hints on when to hit the gas or brakes on your trades.
Using these tools, I’ve seen traders turn their hunches into plans. They use indicators and drawing tools on charting software. Charting software is like a treasure map for traders. It shows the paths a crypto’s price has taken and might take again.
These tools and techniques help with more than just buying low and selling high. They make sense of market moves. Even better, they help in crafting strategies with fewer guesses and more confidence. Remember, using these tools wisely can turn chances into thoughtful trades.
So, let’s get to work! Use these drawing tools and indicators as your guides. They can help you predict and plan like a pro in the wild world of crypto trading.
Advanced Techniques: Exploring Elliott Wave and Gann Fan Theories
Applying Elliott Wave Theory to Crypto Price Movements
We often seek patterns in life, and it’s no different in the crypto markets. Elliott Wave Theory is a masterpiece for spotting market trends. It says prices move in repeating cycles, created by investor psychology. These cycles show up as waves. When I look at crypto prices, I spot five waves in the direction of the trend. Afterward, expect three waves against it. It sounds simple. Yet, picking out these waves can be a game-changer for your trading.
Say Bitcoin starts a new uptrend. First, I draw the first wave up. That’s where the price jumps as people catch on to new, positive news. The second wave comes next as some investors cash out, causing a slight drop. But then, the third wave hits. It’s often the longest, boosted by FOMO (fear of missing out). Waves four and five are where things cool down. Knowledge of these waves helps me predict price turns and leaps.
Gann Fan Insights: Harnessing Historical Angles for Future Projection
Now, let’s talk about the Gann Fan, another mighty tool in our analysis kit. W.D. Gann, a finance legend, believed in the balance of time and price. His Gann Fan combines angles based on date and price ratios to forecast future moves. This tool looks like a fan spread across a chart, each line suggesting a trend’s potential path.
Using the Gann Fan starts with picking a significant high or low on your crypto chart. From there, you fan out lines at set angles. These lines can foretell where prices may find support or run into a ceiling. Dreams of knowing the future? This is as close as it gets in trading.
In the bustling world of crypto trading, these old-school theories from Elliott and Gann are like gold. They cut through the noise, giving us hints and whispers of where the market’s heart beats next. Tools like these boost crypto trading to an art form. Pair them with other techniques, and you’re not just trading; you’re crafting a strategy brimming with insight.
Now, to get real value from these theories, practice is key. Grab your charting software, and dive into the historical data. Draw, erase, compare, and watch patterns emerge. The more you do it, the sharper your predictions become. Remember, in crypto, every detail counts. With every line you draw, you’re one step closer to understanding the market’s rhythm.
The Importance of Chart Annotations and Risk Management in Trading Strategies
Leveraging Annotations for Clarity in Trading Setups
Drawing on charts helps me see things clearly. It’s like marking a trail on a hiking map. Using chart annotations lets me highlight key patterns and trends easily. With trend lines, I can spot where prices may go. They are like paths that prices often follow. By drawing these lines, I can guess future moves.
Candlestick patterns give hints too. They can show if buyers or sellers are winning. This helps me make smart choices on when to buy or sell. Using technical drawing tools for trading makes this part of my work. Even kids understand that green is good and red means be careful. Think of green candlesticks as go signs and red ones as stop signs in trading.
I use support and resistance levels a lot. They are like fences that price bounces between. I draw lines at these levels to see them better. This helps me find good trade spots.
We also have special tools like Fibonacci retracement. This tool works like magic to find hidden price levels. It uses math from nature to predict where prices might stop or reverse. It’s like finding secret steps on a staircase that only some people can see.
Drawing tools are my best friends in crypto trading. I compare different crypto charting platforms to find the best tools. These tools make tough trading calls much simpler. And they help me share my plans with others clearly and quickly.
Integrating Risk Management with Technical Drawing Tools
Drawing tools are like a superhero’s gear in trading, but risk management is the true power. It keeps us safe when things go wrong. By setting limits on my trades, I make sure I don’t lose too much money. I plot pivot points to find places to set these limits. Pivot points help me choose where to say “that’s enough” for both wins and losses.
Trading can be risky. You don’t want all your eggs in one basket. So, I spread my trades out. This way, I don’t get too hurt if one trade goes bad. I always check the volatility, or how much prices jump around. This helps me decide how risky a trade might be.
Each trade is like a new adventure. By using charts and managing risks well, I can keep my trading journey on the right track. It’s not just guesswork. It’s about using every tool I have to make smart, safe trades.
When I draw channels on my charts, I see the price highways better. It guides me to make better moves. Chart annotations help too. They are quick notes to myself on the chart. They remind me of my plan and warn me if I stray off path.
In the end, our goal as traders is to make money and keep it. Using these drawing tools and taking care of risks helps us do just that. It’s exciting to see how these simple lines and shapes can guide us through the wild world of crypto trading.
In this post, we went deep into the tools traders use to read crypto markets. We saw how trend lines and support/resistance levels build a base for analysis. They’re like the ABCs of crypto chart reading. Next, we checked out how the Fibonacci tool and other indicators can sharpen our trading. They’re like adding a zoom lens to our market view.
Then we explored some advanced stuff, like Elliott Wave and Gann Fan theories. Think of them as master class skills that can up our trading game. Finally, we talked about chart annotations and risk management. These are the safety nets that keep our trades smart.
All these techniques help us make better choices in the wild world of crypto trading. Think of them as the toolkit for success. Use them well, and they can help you stay ahead in the game. Remember, trading smart is all about using the right tools at the right time. Happy trading!
Q&A :
What types of drawing tools are available on crypto charting platforms?
Crypto charting platforms come equipped with a variety of drawing tools to assist in technical analysis. These typically include trend lines, Fibonacci retracement tools, ellipses, rectangles, and text note tools. Some advanced platforms may also offer Gann fans, Elliott waves, and pitchforks, among others, allowing traders to visualize and forecast potential market movements more effectively.
How do drawing tools enhance analysis on crypto charting tools?
Drawing tools enhance technical analysis by allowing traders to mark patterns, identify support and resistance levels, and highlight significant price movements on the charts. By using these tools, traders can better understand market trends, track their trading strategies, and make informed decisions based on visual aids, which can complement other analytical methods.
Are there any free crypto charting tools with drawing capabilities?
Yes, many free crypto charting platforms come with basic drawing capabilities. Tools like TradingView or Coinigy offer free versions that include several essential drawing tools for traders to conduct their analysis. Although some advanced features might be locked behind a premium subscription, many users find the free tools sufficient for starting.
How can I use Fibonacci tools on crypto charting platforms?
To use Fibonacci tools, most commonly the Fibonacci retracement tool, select it from your charting platform’s menu of drawing tools. Then, click and drag the tool across a significant swing high and low on the price chart. The platform will automatically place horizontal lines at the key Fibonacci ratios, which often act as potential levels of support or resistance during retracements.
Can I save and share my analysis made with drawing tools on crypto charting platforms?
Yes, several crypto charting platforms allow you to save and sometimes share your technical analysis and drawings. You can often save your chart layouts to revisit later or share them with others within the platform or on social media. This feature is very useful for collaborations, educational purposes, or even for maintaining a record of your trading strategies and historical analyses.


