Dive into the world of Basic Technical Analysis for Beginners:
Ever feel like the stock market’s a puzzle you can’t solve? You’re not alone. Many folks see those squiggly lines and shaded bars as a secret code—meant for the pros. But here’s a secret: you can crack that code too. It’s called basic technical analysis for beginners, and it’s like getting a backstage pass to understanding market moves. In this guide, I’ll show you how to spot trends and make smart moves without getting lost in the jargon. First up, we’ll tackle those funky looking charts — they’re not as scary as they look, I promise. Then, I’ll walk you through patterns and indicators that can act like a compass for your trading journey. Let’s jump in and get you up to speed!
Grasping the Basics of Stock Market Charts
Identifying Candlestick Pattern Basics
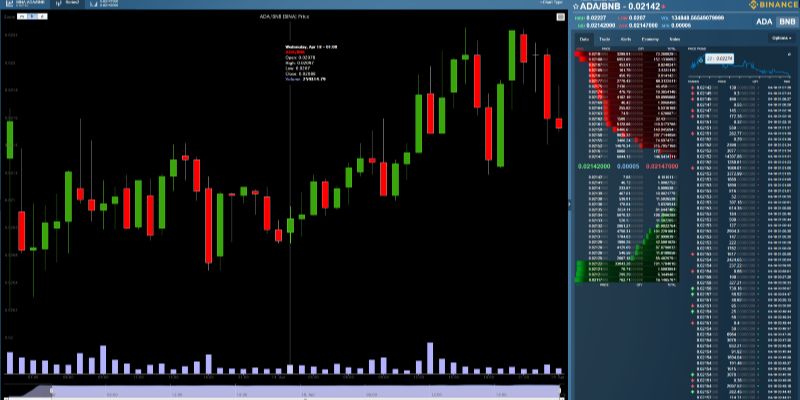
Stock market charts can look like secret codes. But, they’re key to smart trading. Think of each chart as a storybook of the stock’s journey. It’s your guide to understanding how prices move. Charts show how stocks fight between gains and losses. This fighting shapes patterns called candlesticks. Each candlestick shows one day of this fight. They have bodies and wicks, like real candles. The body’s color tells us who won for the day. A green body means buyers won; red means sellers did. Long bodies show strong wins. Wicks above and below the body show the highest and lowest prices. Candlesticks side by side make patterns. These patterns can hint at what might happen next.
Understanding Support and Resistance Levels
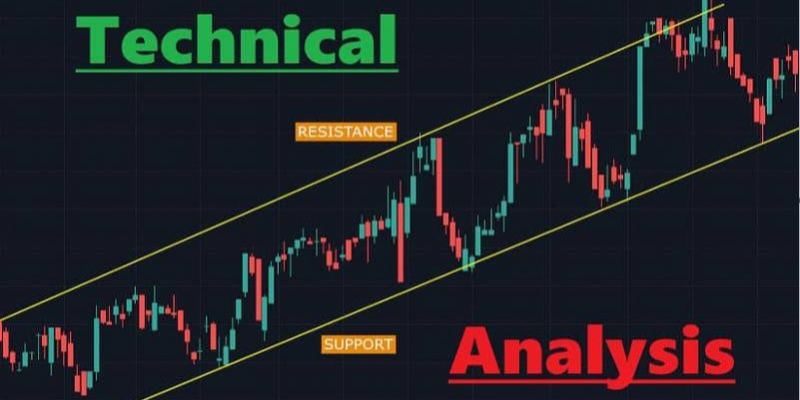
Now, every player needs a field, right? In technical analysis, that’s where support and resistance levels come in. They’re like floors and ceilings in price movement. A support level is where prices tend to stop falling and bounce back up. It’s where buyers step in, thinking the stock is a good deal. On the flip side, a resistance level is where prices often stop rising and might drop. This is where sellers jump in, feeling the stock is too pricey. Understanding these levels helps you guess where prices may head. Suppose a price breaks through resistance. It could climb higher as the ceiling becomes a new floor. If it drops through support, down it could go, as the floor turns into a new ceiling. Hunting these levels on stock market charts takes practice but pays off. It’s like finding the best spots to defend and attack in a game.
By learning to read basic candlestick patterns and spot support and resistance, you start to see the market’s language. Understanding technical analysis is your first step. Dive into the details. Watch the candlesticks and levels. They help you make smart choices when buying or selling stocks. Stick with it, and soon, you’ll handle these basics like a pro.
Chart Patterns and Technical Indicators for Decision Making
Familiarizing with Trading Chart Patterns
Stock markets seem tricky at first. Yet, with the right tools, they unlock big secrets. Let’s start with trading chart patterns. These are like bread crumbs leading us to hidden treasure chests. Sounds cool, right? You bet it is!
Chart patterns give us clues. They tell us where the price might head next. Think of them as stories of past price moves. These stories help predict future moves. For starters, there are simple patterns. Like the ‘head and shoulders’ or ‘double tops and bottoms’. Each has a unique shape on the chart.
Seeing these shapes is like meeting new friends. You learn about them more every day. As a new trader, pay attention to these patterns. They can help you make smart moves.
Exploring Stock Chart Indicators for Starters
Now, onto stock chart indicators. These are like secret codes. Once cracked, they also tell us exciting tales of the stocks. One popular indicator is the Moving Average Convergence Divergence, or MACD for short. It shows if a stock’s on the move or taking a nap.
Another one is the Relative Strength Index (RSI). It tells us when a stock is tired from running up (overbought) or rested and ready to sprint (oversold). Bollinger Bands are another. They act like elastic bands. They tell us if a stock price is stretched too high or low.
Stock chart indicators for starters need not be complicated. They are your allies. They guide you on when to join or exit the stock party.
They are simple marks on a chart. Yet, they hold wisdom of wise old traders from years past. Begin with these basics. Master them like a pro.
Learning this craft is like building your own superpower. It’s exciting to use these technical analysis tools. They spark confidence in your trading journey. Remember, practice makes perfect. Keep exploring and you’ll become the market whisperer you aim to be.
The Role of Moving Averages and Volume in Market Analysis
Moving Averages for New Traders
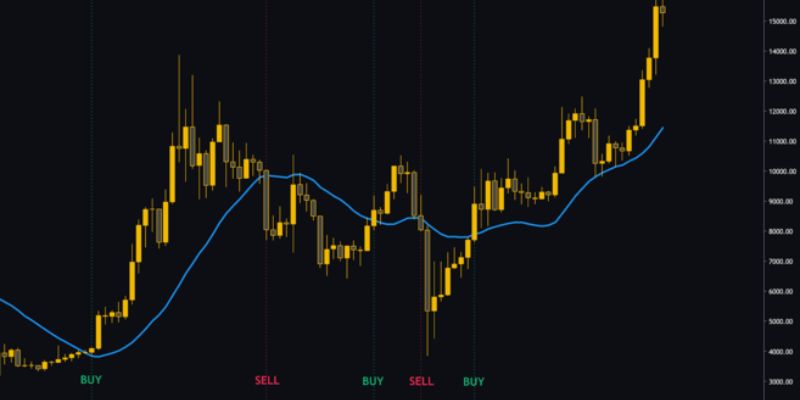
Remember the term moving averages. It’s like a magic wand in your trading toolkit. Think of it as an average stock price over time. It smooths out price data by making a line on your chart. This line helps you spot the trend, whether up, down, or flat.
Moving averages for new traders come in different types. The simple moving average (SMA) is the easiest to understand. You add up the closing prices over a set number of days, and divide by those days. Let’s say you pick 10 days. Add up the closing prices for these 10 days, then divide by 10. That’s your SMA.
There’s also the exponential moving average (EMA). It’s like the SMA but gives more weight to recent prices. This means it reacts faster to price changes than SMA does.
Use moving averages to find support and resistance levels. Prices often bounce off these lines. So, they can help you decide when to buy or sell. If the price is above the moving average, it might be a good time to buy. But if it’s below, it might be time to sell.
Volume Analysis Fundamentals
Now, let’s talk volume. Volume is how many shares are traded in a day. It’s a clue about how strong a price move is. Think of it as the crowd cheering for a move. The louder the cheer, the more likely the move will last.
To start with volume analysis fundamentals, look for big volume days. If a stock moves on high volume, pay attention. It could mean the move is strong and may keep going.
Volume confirms trends. If a stock is moving up on high volume, this is a bullish sign. If it’s moving down on high volume, it’s bearish. Low volume can signal a lack of confidence in the move. It’s like a weak cheer in a big stadium – not convincing.
Reading stock charts 101 must include understanding stock volumes. You need to see if the volume is growing or shrinking over time. If you spot a high volume spike, it can mark a turning point. That’s an important moment for making trading decisions.
In summary, moving averages help you see the trend. Volume shows how strong the moves are. Use both together for a better view of the market. With these tools, you can start to unlock market secrets even as a beginner. Keep practicing, and you’ll get sharper at spotting profitable opportunities.
Establishing Entry and Exit Points through Technical Tools
Utilizing Fibonacci Retracement Levels
Imagine you have a map, where “X” marks hidden treasure. In trading, finding where the price may change is like seeking this “X.” This is where Fibonacci retracement levels shine. They help you see possible future turns in price.
To use them, pick a major high and low on a chart. Draw lines at key spots between these points. These are percentages like 23.6%, 38.2%, 61.8%, and often 50%. They predict where the price might pause or reverse. Why? Because stocks often move in waves, retracing a part before moving again. These levels give hints for entry or exit points, maximizing your trades.
Setting Stop-Loss by Technicals
Protecting your money is key. This is where a stop-loss can help. It’s like a safety net, catching you if prices fall. You set a price under current market value. If the stock hits this level, it sells. So you limit loss and anxiety too. To set it, look for recent low points or just below support levels. Support is where prices stopped falling before, likely to hold.
Don’t set it too tight, or normal price moves may trigger an exit. Not too far, or you might lose more than needed. Finding that sweet spot makes all the difference. It’s about balance.
Using both Fibonacci levels and stop-loss orders creates a solid plan for when to buy and sell. You ride the waves, yet stay safe if the tide turns. Remember, understanding technical analysis is like learning a new language. Practice makes perfect. Use tools like trend lines and volumes to confirm what you see. Blend them for a clear picture. Start simple, grow from there. Take the time – your future self will thank you.
In this post, we covered how to read stock market charts like a pro. We started with candlestick patterns and why knowing support and resistance matters. Then we dug into chart patterns and indicators that guide trading decisions. Moving averages and volume aren’t just fancy terms; they’re keys to market analysis. Finally, we saw how tools like Fibonacci levels and stop-loss settings can pinpoint where to enter and exit trades.
Remember, the market is tricky, but the right tools and knowledge can lead to smart moves. Use what you’ve learned here to look at charts with new eyes. Happy trading!
Q&A :
What is basic technical analysis in stock trading for beginners?
Technical analysis is a methodology used to evaluate securities by analyzing statistics generated by market activity, such as past prices and volume. Beginners should start by learning how to identify trends, study charts, and understand indicators like moving averages, Relative Strength Index (RSI), and support and resistance levels. This approach assumes that price movements often follow historically consistent trends and patterns that can be identified and utilized for potentially profitable trading decisions.
How can beginners learn technical analysis effectively?
Beginners can learn technical analysis effectively by:
- Starting with the Basics: Learn the fundamental concepts such as types of charts (line, bar, and candlestick), trend lines, and volume.
- Reading Books and Online Resources: Invest time in reading reputable books on technical analysis and follow online resources or courses dedicated to trading basics.
- Using Demo Trading Accounts: Apply the knowledge practically through demo accounts, which allow for risk-free trading practice.
- Studying Historical Charts: Analyze historical data to spot trends and patterns.
- Connecting with a Trading Community: Join forums and trading communities to discuss and learn from other traders.
What are the key components of technical analysis for new traders?
The key components of technical analysis for new traders include:
- Price Charts: Understanding how to read and interpret various chart types.
- Trend Analysis: Identifying the direction of market movements.
- Volume: Assessing volume data to gauge the strength or weakness of market trends.
- Indicators and Oscillators: Utilizing tools like moving averages, MACD, and RSI to make informed trading decisions.
- Patterns: Recognizing chart patterns such as head and shoulders, triangles, and flags that indicate potential market behavior.
Can basic technical analysis be used for all types of markets?
Yes, basic technical analysis can be applied to virtually any market where historical price and volume data are available. This includes stocks, forex, commodities, and cryptocurrencies. It’s a versatile tool that traders of various markets can use in conjunction with other forms of analysis to make decisions about when to enter or exit trades. However, it’s important to understand the unique characteristics of each market before applying technical analysis tools.
How much time is required to master basic technical analysis?
The time required to master basic technical analysis can vary greatly among individuals. For some, it takes a few months of consistent study and practice to get comfortable with the basic principles and tools, while for others, it could take a year or more. Mastery comes with experience and the continuous learning of advanced techniques, market observation, and application. It is a life-long learning process where hands-on experience often leads to better understanding.


