As an expert, I’ll let you in on a trade secret: Basic technical analysis for cryptocurrencies is your key to unlocking market movements. Imagine flipping on a light in a dark room. That’s what understanding charts and patterns does for your trades. Knowing how to read the lines and dips sets you apart from the guesswork gang. We’ll start with the ABCs—those charts and candlesticks, and what they whisper about support and resistance. Get these basics down, and you’re one step ahead in the crypto race. Ready to trade smarter? Let’s dive in.
Understanding the Basics of Technical Analysis in Cryptocurrency
The Importance of Cryptocurrency Charts and Candlestick Patterns
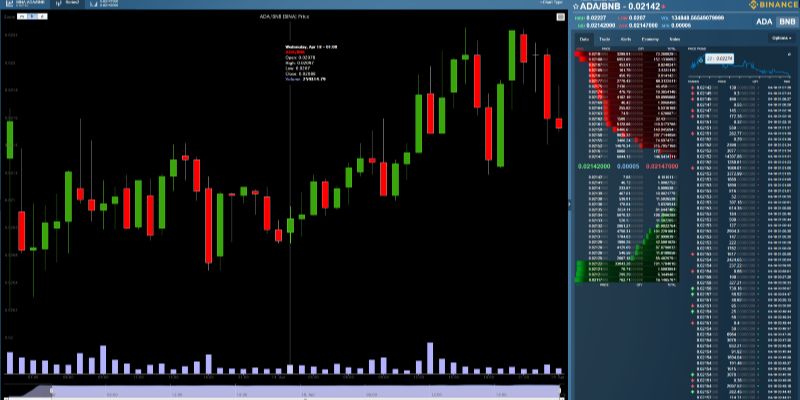
Crypto charts are maps that show us where the price has been. They help us see patterns, like candlestick patterns. We use these to guess where the price may go next.
Candlesticks show price moves within a certain time. Each has a body, showing where the price opened and closed. And it has wicks, telling us the high and the low.
Deciphering Support and Resistance Levels
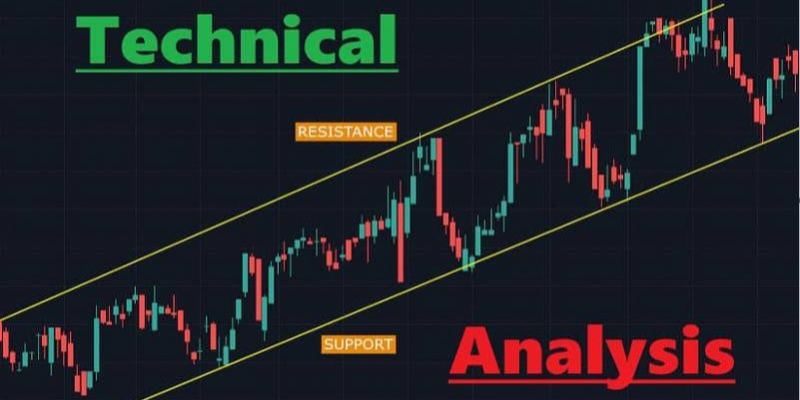
When trading crypto, knowing support and resistance levels is key. These invisible lines show where prices often stop and change direction. They are like floors (support) and ceilings (resistance) for prices.
Support is where prices tend to stop falling and may bounce back up. Resistance is where prices tend to stop rising and may fall again.
Understanding these basic ideas is a great start to mastering crypto trading!
Utilizing Key Technical Indicators for Crypto Trading
Navigating Through Moving Averages and the RSI Indicator
Let’s dig into moving averages and the RSI indicator. They’re like secret codes to price moves! With moving averages, we track average prices over time. They smooth out daily price jumps and show us a trend’s direction. Picture a line weaving along with the price chart. That’s your moving average.
When prices cross above this line, it could mean an uptrend is starting. When they drop below, a downtrend might be coming. Easy, right? We use different types for more clues. A ‘simple moving average’ is just a plain average, but an ‘exponential moving average’ gives recent prices more weight. It’s faster to react to price changes.
Now, let’s chat about the RSI, or ‘Relative Strength Index.’ It shows if crypto is bought or sold too much. The RSI scores from 0 to 100. Above 70 means it might be overbought—so prices could drop. Below 30 means oversold—prices could rise. It’s a handy alert for traders!
Incorporating MACD and Bollinger Bands into Your Trading Strategy
Next up, MACD and Bollinger Bands. Think of MACD as a mood ring for cryptocurrency. It has two lines that cross each other. When the ‘fast line’ jumps above the ‘slow line,’ it could be a buying sign. If it drops below, time to consider selling.
Bollinger Bands are like rubber bands around price charts. They get tight when price moves are small and stretch out when moves are big. Prices usually stay inside the bands. If they break out, get ready! It’s often a sign of a big price move in that direction.
Both tools help spot possible price direction changes. Combined with moving averages and RSI, they make a strong team for our trading game plan. Remember, practice makes perfect when reading these signals.
So there you have it—moving averages, RSI, MACD, and Bollinger Bands. They’re keys to unlocking price secrets in crypto. Use them right, and you’ll be a sharp-eyed crypto trader in no time!
Advanced Technical Analysis Tools and Techniques
Applying Fibonacci Retracement and Trend Lines for Precise Entry Points
People love the mystery of the markets. But even in the wild world of crypto, some things hold true. One of the best tools for finding market secrets is the Fibonacci Retracement. Tied to the math of nature, these levels show where prices might bounce or pivot.
Imagine you’re climbing a hill. Halfway through, you need a break. That’s what cryptocurrencies often do on charts. They go up, take a break at a ‘rest level,’ then keep climbing. These ‘rest levels’ often line up with Fibonacci numbers.
When you draw these levels on a chart, you can spot these rests. Remember, a resting price is a chance. It’s a chance to jump on the price move either up or down. Look at major highs and lows to draw your Fib levels. Pair them with trend lines, which are like the paths the prices hike along. Put them together, and it’s like having a map. A map that helps to say, “Here’s a good spot to enter the market!”
Some might wait for the price to hit these lines. Others might jump in just before, betting it will hold. Either way, these tools help traders find the best spots to get in.
The Relevance of Price Action and Crypto Trading Signals
Price action is like the market’s own language. It tells a story of what’s happening with buyers and sellers. You can see this story in the ups and downs on cryptocurrency charts. It can tell you if a coin is about to break out or if it’s running out of steam.
Crypto trading signals are like tips. They scream, “Hey, look here, something might happen!” These signals often come from technical indicators. Some track trends, others watch for market strength or fear.
Signals and price action together are a strong duo. They can show you potential trades or warn you of risks. It’s all about watching closely. Look for patterns like candlestick shapes or high and low swings.
Tools like crypto scalping strategies use signals for fast wins. But always check the volume. That’s the number of coins traded. It can confirm if a signal is strong or weak. More volume means more traders agree.
In summary, trading isn’t a game of luck. Traders use tools like Fibonacci, trend lines, and signals to make choices. They might not win every time. But using these, they up their chances big time. Just like having a good hand in cards, the right tools can make you more likely to win.
Traders, remember, these tools aren’t magic. They need practice and a sharp mind to use well. Make trades based on facts, not just hope or fear. That’s how you play the crypto game smart.
Combining Technical Analysis with Market Psychology
Identifying Market Cycles and Using the Elliott Wave Theory
Market cycles in crypto can look like a rollercoaster ride. They go up and down. This pattern repeats. The Elliott Wave Theory helps us catch the ride. It says price moves in waves. There are five “up” waves and three “down” waves. We use these to predict where prices might go next.
How can the Elliott Wave Theory predict price movement?
It predicts because these waves follow human emotions. When people are happy, they buy, and prices go up. When people are scared, they sell, and prices go down. By reading these waves, we get a sneak peek at the market’s mood.
Now let’s dig deeper. Look at a crypto chart with this theory. You’ll see five waves that push the price higher. After comes a correction with three waves going down. Spotting these can guide you to when to enter or exit a trade. It’s all about timing. And in trading, timing is everything.
But it’s not just about ups and downs. Each wave has its own vibe. For example, the third wave is often the strongest. That’s when the most people join the party, driving prices way up. If you catch wave three, you could be in for a big win.
Understanding Accumulation and Distribution Phases with the Wyckoff Method
Another cool tool is the Wyckoff Method. This method shows how big traders affect prices. They’re the whales in the ocean of crypto. We want to swim with them, not against them. The method has two main parts: accumulation and distribution.
What are the accumulation and distribution phases in crypto?
Accumulation is when big players buy a lot without making prices jump. They’re sneaky. Prices stay flat, but they’re secretly getting more coins. We look for signs in volume and price action.
Distribution is the opposite. Whales are selling. But, they do it slowly so prices don’t crash right away. The price might seem stable, but it’s ready to drop. Again, we watch volume and how prices react.
By using the Wyckoff Method, we’re like detectives. We spot the clues big traders leave behind. This can show us if a coin is ready to pop or drop. Learning this method takes practice. But once you get it, you’ll read the market like a pro.
When we combine tools like Elliott Wave and Wyckoff with charts, patterns, and indicators, we’re not just trading. We’re listening to the market’s heartbeat. And knowing its rhythm can lead us to make better trades. Remember, it’s not magic. It’s about learning to read the signs and acting on them.
In crypto trading, you want every advantage you can get. Understanding market cycles and the Wyckoff Method gives you that edge. Take the time to learn. It could help you ride the waves of crypto markets with confidence.
In this post, we explored how technical analysis guides us in trading cryptocurrency. We started with the basics, learning how charts and candlestick patterns are key to understanding price moves. We looked at support and resistance to tell when prices might change.
Next, we talked about key indicators like moving averages and the RSI. Using MACD and Bollinger Bands can also shape your trading plan.
Then, we dived into advanced tools. Fibonacci and trend lines help find the right time to enter the market. Knowing price action and signals can lead to smarter trades.
Last, we saw how market psychology affects trading. We discussed market cycles with Elliott Wave Theory and examined the Wyckoff Method’s phases of accumulation and distribution.
I hope these insights make you a savvy trader. With practice and these tools, you’ll read the market like a pro.
Q&A :
What is basic technical analysis in cryptocurrency trading?
Basic technical analysis in cryptocurrency trading involves the study of past market data, primarily price and volume, to forecast future price movements. Traders use various technical indicators and chart patterns to identify trends and potential trading opportunities. Understanding support and resistance levels, as well as utilizing tools like moving averages, RSI (Relative Strength Index), and MACD (Moving Average Convergence Divergence) are fundamental to this approach.
How can beginners learn technical analysis for cryptocurrencies?
Beginners can start learning technical analysis for cryptocurrencies by studying foundational concepts such as candlestick patterns, trend lines, and volume. They should practice by looking at historical price charts and identifying patterns. Additionally, plenty of online resources, including courses, tutorials, and books, are available. Practicing with a demo trading account can also provide hands-on experience without the financial risk.
What are some common technical analysis tools used for cryptocurrencies?
Some common technical analysis tools used for cryptocurrencies include:
- Candlestick charts, to visualize price movements
- Moving averages, to determine trend directions and strength
- RSI, to assess whether an asset is overbought or oversold
- Fibonacci retracement levels, to identify potential support and resistance areas
- MACD, to spot changes in momentum and potential trend reversals
- Volume indicators, to validate the strength of a trend or a pattern
Can technical analysis predict cryptocurrency prices accurately?
While technical analysis can provide insights into potential price movements based on historical data, it cannot predict cryptocurrency prices with absolute accuracy. Cryptocurrency markets are influenced by a wide range of factors, including market sentiment, news events, and macroeconomic trends, which can all impact prices in unpredictable ways. Traders use technical analysis as one of many tools to gauge the likelihood of future price actions, but it should not be relied upon exclusively.
What is the difference between technical and fundamental analysis in crypto trading?
The primary difference between technical and fundamental analysis in crypto trading lies in their approach. Technical analysis focuses on price action and market statistics to infer future price movements, whereas fundamental analysis evaluates the intrinsic value of a cryptocurrency based on factors like technology, use cases, market adoption, developer activity, and regulatory environment. While technical analysis looks for patterns and trends in trading data, fundamental analysis seeks to determine the underlying value and potential of the cryptocurrency.


