Diving into technical indicators on crypto charting tools can be like finding a gold mine. Ever felt lost in the maze of lines and shapes on crypto charts? I did, till I mastered the markers that hint at what’s next. Let’s get real – the market won’t wait for us to catch up. You need to speak its language, and that’s where trend indicators come in. I’ll guide you through the twists and turns of Bollinger Bands and MACD, and we’ll break down how to pinpoint market directions with trend lines and moving averages. Strap in; it’s going to be an insightful ride.
Navigating Crypto Market Trend Indicators
Utilizing Bollinger Bands and MACD for Trend Analysis
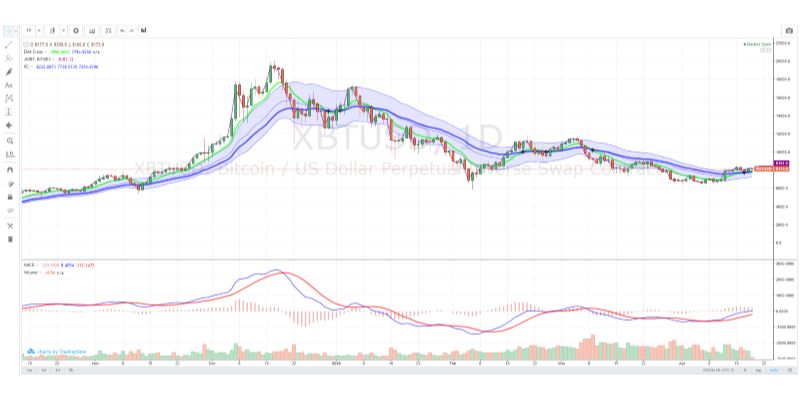
In crypto, spotting the trend is key. We start with Bollinger Bands and MACD. Bollinger Bands show if prices are high or low on a relative basis. They squeeze to signal low volatility and widen with higher volatility. This can tell us if a big price move is near.
Now, for the MACD. It finds trends and reversals. The MACD line crossing over the signal line hints at a buy signal. If it does the opposite, it’s likely a good time to sell. Combining it with Bollinger Bands offers a deeper insight into potential price movements.
Applying Trend Lines and Moving Averages for Directional Insight
Then we draw trend lines. These connect low points and high points of price. A rising trend line suggests prices are likely climbing. A falling trend line hints they’re dropping. They also help us spot breakout points.
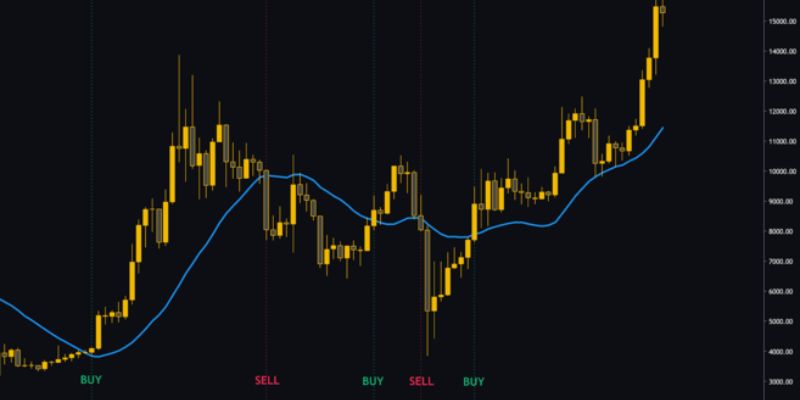
Moving Averages are like a smooth path over rocky price movements. A rising moving average hints the trend is up. If it’s going down, the trend might be down. A crossover between short-term and long-term moving averages can be a powerful sign. It lets us take a peek into where the trend may go next.
Both tools bring the chart alive. They offer vital clues to the direction of the market. They help us see through the noise of market swings. It’s like having insider knowledge on what may come. With practice, these tools can power up any trader’s game. They turn complex data into clear, actionable insight. They’re like trusty guides in the often wild journey of crypto trading.
Deciphering the Strength of Crypto Movements
Analyzing Volume Indicators and the RSI for Trade Signals
Volume tells us how much trading went on in a given time. High volume hints at big interest in a coin. It can signal a start or end to a trend. Knowing this, we join trades with confidence. We use volume indicators for digital currencies to catch these moments.
The Relative Strength Index (RSI) measures if a coin is overbought or oversold. An RSI over 70 means a coin might fall in price. Below 30 suggests it might go up. RSI is a friend who whispers tips about possible next moves.
But, remember, RSI and volume need each other. Think of them like salt and pepper – both add flavor to your dish. Together, they shape strong trade signals.
Integrating Stochastic Oscillator and ATR for Momentum and Volatility
Now, let’s chat about speed and wildness in crypto. The Stochastic Oscillator shows us the momentum. It ranges from 0 to 100. A reading above 80 means ‘slow down’, the coin might be overbought. Below 20 yells ‘pay attention’, it could be ripe for buying.
Momentum indicators for crypto traders are key. They help us catch coins that are picking up speed. We jump in to ride the wave with these quick hints.
Volatility is like the sea – calm or stormy. The Average True Range (ATR) indicator is our measure here. It tells us how much the price moves on average. Big ATR? Strap in for a wild ride. Small ATR? Smooth sailing ahead.
With ATR, we sense the crypto sea’s mood. Then we decide if we want to surf or watch from the beach. Both the Stochastic Oscillator and ATR guide us in this wild crypto journey, helping us make smart moves.
Understanding volume, RSI, momentum, and volatility gives us clues. These clues lead to smarter trades. We become treasure hunters, decoding the market’s secrets. The result? We might find the hidden gems in the crypto world.
The Significance of Support and Resistance levels
Employing Fibonacci Retracement for Reversal Points
You’ve seen them – lines that run through crypto charts. They’re not just for show. These lines help traders find reversal points in markets. They’re called Fibonacci retracement levels. These levels seem like magic, but they’re based on math.
Retracement means the price might bounce back from these lines. Think of it as a crypto rubber band. Price stretches away but snaps back to these lines. Why? Because other traders see them, too. They buy or sell based on them. This makes these lines powerful.
Say Bitcoin drops after hitting a high. You draw lines at certain percentages from the high down to the low. These are your Fib levels: 23.6%, 38.2%, 61.8%, and 100%. They’re magic numbers from Fibonacci’s sequence. Now, watch how the price acts at each line. It’s like a step ladder. The price climbs or drops, touches a line, and then you see. Will it keep going or turn around?
Most look at the 61.8% level. It’s like the star of the show. If price touches it and bounces back, traders get excited. They think, “Aha! The trend might change!” They get ready to act – buy or sell.
Recognizing Candlestick Patterns Around Key Price Levels
Now, let’s add candlesticks to the mix. These are not just simple price markers. They tell stories. Stories of battle between buyers and sellers. Who wins more can push the market up or down.
Candlestick patterns have names like hammers and shooting stars. They signal traders to get ready. They form around those support and resistance lines I mentioned before. A hammer at support might mean “Good news! Prices could rise!” A shooting star at resistance? “Uh-oh, prices might fall.”
Traders look for these patterns to confirm their hunches. It’s like a double-check before they trade. They see a pattern forming at a Fib level and think, “Bingo! Time to make a move.” They use this as a clue. A clue to whether they should wait, buy, or sell.
Remember, in crypto trading, details matter. Every line, every candlestick pattern can tell you something. Know what you’re looking at, and you could make better moves. Better moves mean better chances to win in this market. It’s a tool nobody should ignore.
So, next time you’re charting, draw those Fib lines. Watch for candlestick patterns. They might just show you where the market’s headed next. With practice and patience, you might read the market like a book. A book that could lead you to make smarter, sharper trades.
Advanced Strategies in Crypto Technical Analysis
Implementing Ichimoku Cloud and Pivot Point Analysis in Real-Time
Ichimoku Cloud is your map in the crypto sky. It shows where prices may go. You see lines on charts. These lines mix past, present, and future prices. The cloud has two parts: one leading, one lagging. They tell us if bulls or bears might win. Use this tool while trading. It’ll help guide you through the crypto market’s twists and turns.
Now, let’s add a secret weapon: Pivot Point Analysis. This helps traders find important price levels. We look at past highs, lows, and closes. This mix shows us potential support and resistance. These are price points where trends can change. Pivot points help you spot these key zones fast. So, you can make smart moves before others do.
Mastering Elliott Wave Theory and Divergence Indicators for Price Forecasts
Elliott Wave Theory is like a crystal ball. It predicts where crypto prices could go. Picture the market as waves in the ocean. Some big, some small, they all follow a rhythm. This theory says that prices move in patterns. We can boil it down to five main waves. Learn these patterns, and you’re ahead in the game.
Then, there are divergence indicators. These are your stealthy lookouts. They spot trouble before it shows on the surface. Divergence happens when price and an indicator like RSI or MACD don’t agree. Think of it as a warning. A hint that a trend might change soon. Keep an eye on these subtle clues. They often signal when to enter or exit trades.
Mining the depths of charts with tools like these takes skill. But with practice, you become the wise navigator of the volatile crypto seas. Your trades will thank you for it.
We just went through a lot about crypto trends, how we spot them, and what tools we use. We looked at Bollinger Bands, MACD, and trend lines to figure out where the market might go. Then we checked out how volume and RSI can signal when to make a trade. We learned that things like the Stochastic Oscillator and ATR help us get the feel of market momentum and choppy price moves.
Knowing where support and resistance are is key. We use Fibonacci and candlestick patterns to spot possible flips in the market. Lastly, for the pros, we dived into using Ichimoku Cloud and pivot points while trading live. We also saw how the Elliott Wave theory and divergence can predict price changes.
All these strategies and indicators can seem like a lot. But when you get them down, they can really help you in the crypto world. It’s about practice and getting comfy with these tools. Start small, keep learning, and you just might get an edge in this fast-moving market. Happy trading!
Q&A :
What are the main technical indicators used in crypto charting tools?
Technical indicators are crucial for analyzing cryptocurrency market trends. The most commonly used indicators in crypto charting tools include Moving Averages (MA), Relative Strength Index (RSI), Bollinger Bands, Moving Average Convergence Divergence (MACD), and Volume. Traders use these to predict future market movements and to make informed trading decisions.
How can I apply technical indicators to improve my crypto trading strategy?
To improve your crypto trading strategy with technical indicators, you need to understand how each one works and what it signals. For instance, the RSI can show if the asset is overbought or oversold, while MACD can indicate a trend reversal. By combining different technical indicators, you increase your chances of executing successful trades, as you have more data points confirming a trend.
Are technical indicators on crypto charting tools reliable for short-term trading?
Technical indicators can be particularly useful for short-term trading in the volatile crypto market. However, while they provide valuable insights, their reliability depends on market conditions and how they are used. Indicators like RSI and MA can respond quickly to price changes, offering timely information for short-term decision-making, but they should be combined with other analysis methods to ensure accuracy.
Do crypto charting tools with technical indicators require previous trading experience?
While having trading experience can be beneficial, many crypto charting tools with technical indicators are user-friendly and designed with both novices and experienced traders in mind. These tools often provide tutorials and guidance on how to interpret different indicators. However, a basic understanding of market principles and technical analysis is recommended to utilize these tools effectively.
Can technical indicators predict the future price of cryptocurrencies?
Technical indicators are not capable of predicting the future price of cryptocurrencies with complete certainty. They are used to analyze historical price data and market trends to forecast potential price movements. While they can be powerful tools in predicting probable outcomes based on past performance, they cannot account for unforeseen market events or news that can drastically influence prices.


